Veterans United in
Dallas-Fort Worth-Arlington, TX
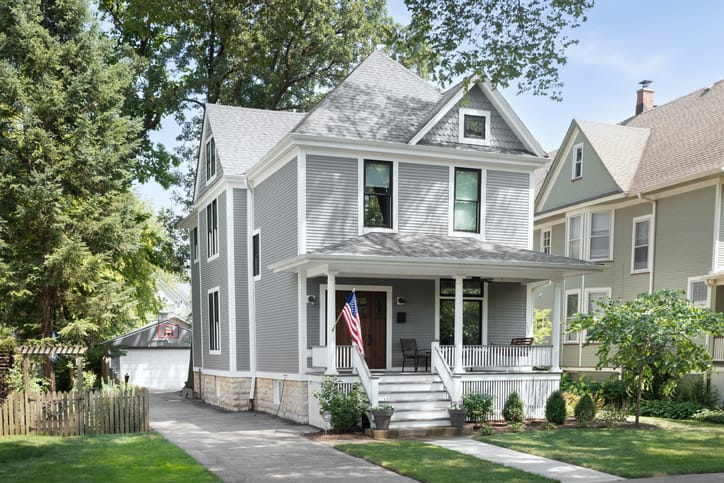
The Dallas housing market in February has weakened compared to last year with the median home price around $405,000 — down 2.5% from last year. Homes for sale in Dallas* now spend an average of 72 days on the market, and nearly 27% sell below asking price, giving buyers more negotiating power.
Just a few of the 775,348 Veterans we've helped get into homes.
9,804 Veterans in the Dallas-Fort Worth-Arlington, TX area alone!
Based on Veterans United and Veterans United Realty's internal data.
Bradley O. | U.S. Marine Corps
Laura E. | U.S. Army
Herbert J. | U.S. Navy
Madelyn Q. | U.S. Navy
Michelle M. | U.S. Army
Phillip P. | U.S. Navy
Billy R. | U.S. Army
Dallas Metro Housing Market in February 2026
Median Days on Market
72 days
Homes are staying on the market 1.41% longer than last month.
Average Listing Price
$599,523
Average home prices are down 2.06% since last month.
Active Listings
22,766 homes
Number of houses on the market are down 9.7% since last month.
Homes in the Dallas region sell at a moderate pace.
27% of listings reduced price last month.
7,120
New listings
Up 19.6% from last month
22,766
Active listings
Down 9.7% from last month
VA Loan Market Share
6.7% of originations last year were VA loans.
6,105
Sold last year
1/15
Were VA loans
Dallas Area
Own vs Rent Trends
A higher share of owner-occupied homes often reflects stronger long-term ties to the community, since homeowners are more likely to stay in one place and invest in their neighborhoods. By contrast, areas with a larger renter population may be more transient, offering flexibility but sometimes less stability in housing markets.
It could also be an indication of market health, as affordable markets often have higher owner-occupancy rates.
The home listing price-to-income ratio in the Dallas area is 4.7
The ratio compares how expensive homes are in Dallas relative to household income. A higher ratio means homes cost more compared to what people earn.
A healthy price-to-income ratio is generally around 3 times your household's annual income (or less), but higher ratios can be sustainable depending on your rate, DTI, and more.
Median Home Prices by Neighborhood in the Dallas Region
This section breaks down median home prices by neighborhood. Use these insights to see where housing costs trend higher or lower, and to better understand the market at the zip code level.
The Dallas metro median income is $86,860.
Explore Dallas Area Neighborhoods
See how median home prices in individual Dallas neighborhoods compare to the overall metro median.
View this chart to learn about the median listing price and the number of active listings in Dallas over time.
Month
Mar 2022
Apr 2022
May 2022
Jun 2022
Jul 2022
Aug 2022
Sep 2022
Oct 2022
Nov 2022
Dec 2022
Jan 2023
Feb 2023
Mar 2023
Apr 2023
May 2023
Jun 2023
Jul 2023
Aug 2023
Sep 2023
Oct 2023
Nov 2023
Dec 2023
Jan 2024
Feb 2024
Mar 2024
Apr 2024
May 2024
Jun 2024
Jul 2024
Aug 2024
Sep 2024
Oct 2024
Nov 2024
Dec 2024
Jan 2025
Feb 2025
Mar 2025
Apr 2025
May 2025
Jun 2025
Jul 2025
Aug 2025
Sep 2025
Oct 2025
Nov 2025
Dec 2025
Jan 2026
Listing Price
$425,000
$440,000
$474,631
$488,781
$479,900
$462,500
$453,530
$449,999
$447,379
$435,213
$430,000
$435,000
$442,000
$459,900
$468,995
$472,912
$469,999
$464,376
$450,000
$449,000
$445,000
$435,000
$431,088
$435,000
$439,990
$449,900
$459,450
$459,000
$450,000
$444,990
$439,450
$434,500
$428,000
$422,450
$415,500
$415,950
$423,503
$430,000
$440,000
$440,000
$439,900
$430,000
$425,000
$425,000
$420,000
$412,500
$405,000
Month
Mar 2022
Apr 2022
May 2022
Jun 2022
Jul 2022
Aug 2022
Sep 2022
Oct 2022
Nov 2022
Dec 2022
Jan 2023
Feb 2023
Mar 2023
Apr 2023
May 2023
Jun 2023
Jul 2023
Aug 2023
Sep 2023
Oct 2023
Nov 2023
Dec 2023
Jan 2024
Feb 2024
Mar 2024
Apr 2024
May 2024
Jun 2024
Jul 2024
Aug 2024
Sep 2024
Oct 2024
Nov 2024
Dec 2024
Jan 2025
Feb 2025
Mar 2025
Apr 2025
May 2025
Jun 2025
Jul 2025
Aug 2025
Sep 2025
Oct 2025
Nov 2025
Dec 2025
Jan 2026
Active Listings
4,589
5,456
8,106
11,301
14,862
16,553
16,528
17,494
17,906
16,429
14,776
12,786
12,398
12,529
13,160
14,674
16,142
16,929
17,285
18,625
18,953
17,347
15,777
16,012
17,096
18,531
20,080
22,364
24,446
25,481
25,769
25,908
25,494
22,744
21,422
21,794
23,675
26,471
29,084
30,998
31,819
30,910
30,064
29,448
28,512
25,211
22,766
Median Days on Market
Days on Market
This chart shows the median days on market for active listings over time. In other words: how quickly homes move in the market. A declining rate means rising competition among buyers, while an increase means listings are sitting longer.
Month
Mar 2022
Apr 2022
May 2022
Jun 2022
Jul 2022
Aug 2022
Sep 2022
Oct 2022
Nov 2022
Dec 2022
Jan 2023
Feb 2023
Mar 2023
Apr 2023
May 2023
Jun 2023
Jul 2023
Aug 2023
Sep 2023
Oct 2023
Nov 2023
Dec 2023
Jan 2024
Feb 2024
Mar 2024
Apr 2024
May 2024
Jun 2024
Jul 2024
Aug 2024
Sep 2024
Oct 2024
Nov 2024
Dec 2024
Jan 2025
Feb 2025
Mar 2025
Apr 2025
May 2025
Jun 2025
Jul 2025
Aug 2025
Sep 2025
Oct 2025
Nov 2025
Dec 2025
Jan 2026
Median Days on Market
25
23
22
22
29
35
43
45
49
59
66
61
46
40
37
36
37
42
44
46
50
58
63
48
40
40
37
40
43
49
53
56
58
66
69
56
45
43
45
50
53
58
63
64
64
71
72
Market Hotness Score
Market Hotness
Based on Realtor.com's Market Hotness Index, this measure reflects how competitive the housing market is by comparing buyer demand with available inventory. Rising hotness scores point to more competition, while declining scores signal cooling conditions.
Month
Mar 2022
Apr 2022
May 2022
Jun 2022
Jul 2022
Aug 2022
Sep 2022
Oct 2022
Nov 2022
Dec 2022
Jan 2023
Feb 2023
Mar 2023
Apr 2023
May 2023
Jun 2023
Jul 2023
Aug 2023
Sep 2023
Oct 2023
Nov 2023
Dec 2023
Jan 2024
Feb 2024
Mar 2024
Apr 2024
May 2024
Jun 2024
Jul 2024
Aug 2024
Sep 2024
Oct 2024
Nov 2024
Dec 2024
Jan 2025
Feb 2025
Mar 2025
Apr 2025
May 2025
Jun 2025
Jul 2025
Aug 2025
Sep 2025
Oct 2025
Nov 2025
Dec 2025
Jan 2026
Hotness Score
69.8997
66.0535
66.7224
70.2341
60.3679
63.5452
57.3579
56.689
54.0134
56.689
59.0301
51.0033
54.5151
56.3545
54.0134
56.8562
54.5151
45.6522
45.8194
47.4916
46.1538
49.3311
54.5151
57.5251
54.6823
49.8328
47.3244
43.8127
45.6522
42.4749
37.6254
38.9632
43.8127
45.6522
49.1639
52.8428
51.0033
45.9866
38.2943
37.7926
36.6221
35.4515
34.2809
34.2809
40.1338
44.3144
48.495
Pending Homes-for-Sale %
Percentage of Homes Sold per Month
This chart shows the percentage of homes that sold each month, highlighting buyer demand and long-term market trends. In most markets, around 20% of listings selling each month is considered balanced. Higher percentages point to a strong sellers' market, while lower percentages indicate more favorable conditions for buyers.
Largest overall VA lender (purchase and refinance) for seven of the last ten years.
More VA purchase loans than any other lender for the past 10 consecutive years
Over the last six years, Veterans United made more VA purchase loans than USAA, Navy Federal Credit Union, Rocket Mortgage, Wells Fargo and Freedom Mortgage combined.
VA buyers who shop slightly under budget often have more flexibility to make competitive offers, especially on homes that have been on the market for more than 30 days. Some of the best fits for my clients have been in bedroom communities, near military bases or in areas with strong Veteran support and community.
Lori F.Veterans United Network Realty Agent
1-800-985-5723 | 1512 Heriford Road, Columbia, MO 65202. Not affiliated with any government agency including the VA. Missouri Licensed Real Estate Brokerage; for license information, visit VeteransUnitedRealty.com. Equal Housing Opportunity.
Start Your VA Loan With Veterans United
Not sure where to begin? Whether you're stationed nearby or planning to move near Dallas, we’ll help you understand what to expect.
Everyone from accounting team to the loan team have been outstanding. Have no complaints. Worked with me at every step.
Austin L. | Marine Corps
Verified Customer
Veterans United staff was couteous, kind, efficient and very diligent about all they did. We greatly appreciate their service and would highly recommend Veterans United, especially Phil Smyser, Loan Officer and Tyler Meyer, Loan Coordinator. TY you all!
Teodoro V. | Marine Corps
Verified Customer
Working with Zack and his team was a blessing. This whole process was as smooth as could be. We couldn't be more pleased.
Ysmael B. | Army
Verified Customer
You really kept me up to date on what documents were needed and what inspections and insurance was needed. Thank you for helping me purchase a new home.
Judith B. | Navy
Verified Customer
A+++ Justin and his team at Veterans United communicated very well every step of the way, answered all of our questions promptly, and did a phenomenal job to ensure we met the closing date in a very short time frame. I would definitely trust Veterans United again if I was making another home purch...
Kenneth B. | Air Force
Verified Customer
Best experience (4th time buying a house).....the team moved like a well trained military unit. I sincerely appreciate the professionalism, competence and level of integrity exemplified by each team member I worked with in this process. Also impressed with the diversity of the team and how well the...
Christina M. | Army
Verified Customer
I had a pleasurable experience with Veterans United and even after closing on the home, they said they would be there for any questions I would have. My whole team has been great even through the delays by the seller. I would recommend Veterans United to any veterans looking to use their VA loan to ...
Phillip P. | Navy
Verified Customer
- Incredible Experience!!!- Jason, Megan, Crosby, Katie, Garrett- were there every step of the way; if I had a ?, and there were many- Jason- more than most, would get back to me, if not, then Megan would be next to back up, Jason....Went Beyond means to assist/help myself with my dumb and reoccurr...
Donald B. | Marine Corps
Verified Customer
Aaron, Dennis, Ashley, Michelle, Lindsey, Tere’sa - the full team were amazing from beginning to end! After so many horror stories from friends about the home-buying process had us anxious but between the task lists, continuous follow-ups, and communication - this was one of the easiest processes ...
Kevin S. | Air Force
Verified Customer
The process was very easy. Definitely easier than what I was expecting. They work with you every part of the process, so you know what to except.
Tayler J. | Army
Verified Customer
Veteran’s United helped us buy our first home. Each member of our team was super knowledgeable and their communication skills were top tier! The response time was also very short if we had questions!
Madelyn Q. | Navy
Verified Customer
Josh J. and the team were all amazing. They made getting the home so easy and quick. Josh was always available for questions and quick with answers.
Stephen Z. | Army
Verified Customer
Hunter was absolutely beyond exceptional. I had a million questions along my 6 month process of looking into buying a property. He was extremely patient, attentive, and knowledgeable. If he didn’t have an answer he was honest and looked into it for me. I would absolutely recommend working with him...
*Unless stated otherwise, data for the metro refers to the CBSA ("Core-Based Statistical Area"), the defined geography that makes up the surrounding metropolitan and micropolitan areas.
We Use Cookies and Pixels
This website uses cookies, pixels, and similar tracking technologies to improve site functionality,
as well as for analytics and advertising.
By continuing, you agree to our use of cookies, pixels, and similar tracking technologies.
Learn more about our use of tracking technologies in our
privacy policy.